Iranian Intellectuals’ orientations and attitudes have an essential difference with their western counterparts. The most important characteristic of the political orientations of the western intellectuals is their normal distribution. My experience of living in the Iranian society leads me to conclude that the distribution is not normal in Iran. It may be something like the graph below:

I have discussed this earlier (here) and I will not repeat it here, but I should mention that in the western transiting societies in 18th and 19th centuries there has been a unifying process which has forced most of the intellectuals to concentrate in some specific points of the spectrum. This process is modernity. In my point of view, modernity, in spite of its diversifying tendencies can also be taken into account as a process of unification. It makes no difference whether you consider it from Durkheim’s functionalist perspective as “organic solidarity” or from the critical perspective of Frankfurt School who saw it as “decline of Individuality” and developing “similarity”. As I have mentioned in the previous posts, modernity in Iran has not been a process.
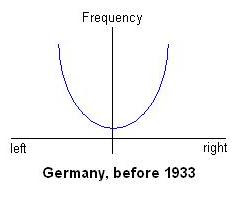
It seems that our conclusion does not apply to some western countries, such as Germany. The downfall of the Weimar Republic and rise of Nazism is precisely the consequence of the lack of normal distribution in the political orientations of German Intellectuals and people. Most of the Intellectuals (and people) were extremely right or extremely left. By 1933 the Communist Party had more than 300,000 members and the National Socialist Party had mobilized a lot of people under its flag. The society had been polarized: the communists and the Nazists.
There were little people in the “middle” to support democracy and rescue the Weimar Republic. This situation can be illustrated as below:
 Of course Germany in those years was a modern society, but it was at the same time non-coherent and fragmented. Historically, the lack of social cohesion and efforts of nationalist movement to unite the society emerged the above-mentioned situation.
I think this is also different from the chaotic distribution of political orientations in Iran in our times. The Iranian distribution model is not polarized, because Iran is not completely modern. The consistency of political orientations in this society is low. Moreover, the lack of solidarity in Iran is not due to the lack of historical national identity. I have pointed it earlier (here) that the national identity has maintained the Iranian society cohesive during tens of centuries and now it can still be a unifying factor. This prevents the polarization of the society.
Data Analysis
I have uses the data from World Values Survey to investigate the accuracy of this claim. The survey measures “self positioning in political scale” in a spectrum from 1 (most leftist) to 10 (most rightist). First of all I have made a comparison between Iran, United States and Canada. US and Canada have been chosen as two of the most developed and modern countries. The following graph shows this comparison.

At first glance, it seems that all of these countries have normal distribution to some extent. But if we pay more attention it will be clear that the only reason for one to think that Iran reconciles with the normal distribution pattern is the amount of respondents to item 5. Analysis of the data from other countries indicates an important point. As you can see in the graph bellow, item 5 is most chosen in all the countries.


To be continued…